
This indicator examines the frequency, intensity, and duration of hurricanes and other tropical storms in the Atlantic Ocean, Caribbean, and Gulf of Mexico.
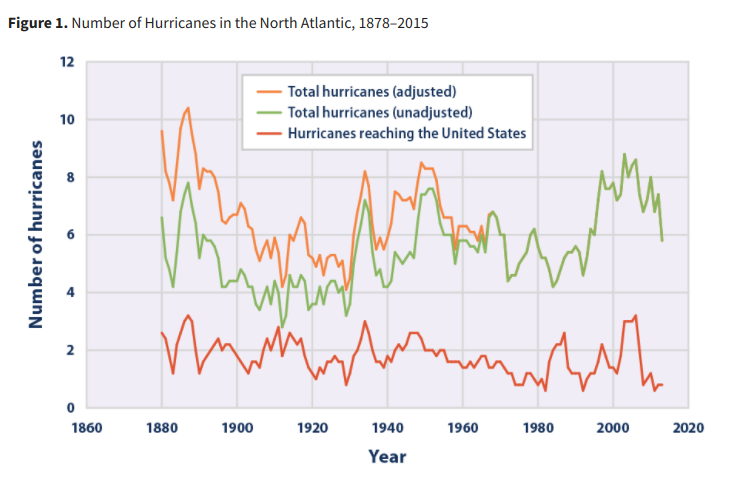
Records of tropical cyclones in the Atlantic Ocean have been collected since the 1800s. The most reliable long-term records focus on hurricanes, which are the strongest category of tropical cyclones in the Atlantic, with wind speeds of at least 74 miles per hour. This indicator uses historical data from the National Oceanic and Atmospheric Administration to track the number of hurricanes per year in the North Atlantic (north of the equator) and the number reaching the United States since 1878. Some hurricanes over the ocean might have been missed before the start of aircraft and satellite observation, so scientists have used other evidence, such as ship traffic records, to estimate the actual number of hurricanes that might have formed in earlier years.
This indicator also looks at the Accumulated Cyclone Energy (ACE) Index and the Power Dissipation Index (PDI), which are two ways of monitoring the frequency, strength, and duration of tropical cyclones based on wind speed measurements.
Every cyclone has an ACE Index value, which is a number based on the maximum wind speed measured at six-hour intervals over the entire time that the cyclone is classified as at least a tropical storm (wind speed of at least 39 miles per hour). Therefore, a storm’s ACE Index value accounts for both strength and duration. The National Oceanic and Atmospheric Administration calculates the total ACE Index value for an entire hurricane season by adding the values for all named storms, including subtropical storms, tropical storms, and hurricanes. The resulting annual total accounts for cyclone strength, duration, and frequency. For this indicator, the index has been converted to a scale where 100 equals the median value (the midpoint) over a base period from 1981 to 2010. The thresholds in Figure 2 define whether the ACE Index for a given year is close to normal, significantly above normal, or significantly below.
Like the ACE Index, the PDI is based on measurements of wind speed, but it uses a different calculation method that places more emphasis on storm intensity. This indicator shows the annual PDI value, which represents the sum of PDI values for all named storms during the year.
