
This indicator examines changes in the size and frequency of inland river flood events in the United States.
The U.S. Geological Survey maintains thousands of stream gauges across the United States. Each gauge measures water level and discharge—the amount of water flowing past the gauge. This indicator uses total daily discharge data from about 500 long-term stream gauge stations where trends are not substantially influenced by dams, reservoir management, wastewater treatment facilities, or land-use change.
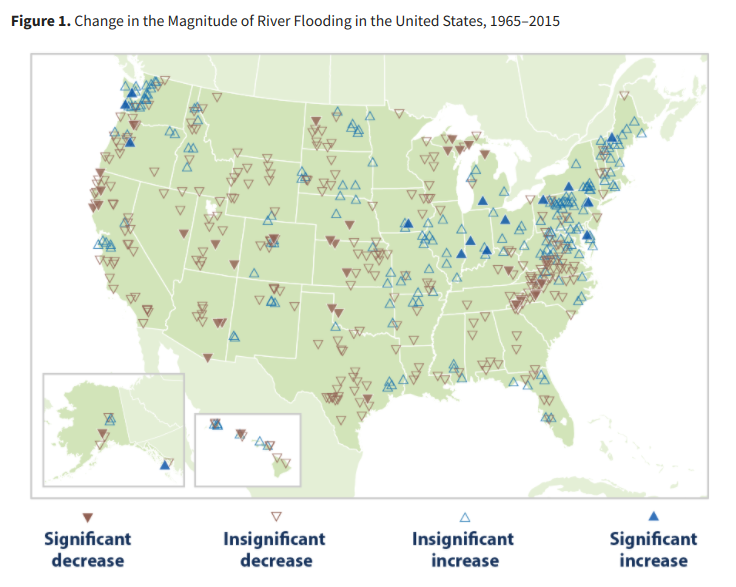
One way to determine whether the magnitude of flooding has changed is by studying the largest flood event from each year. This indicator examines the maximum discharge from every year at every station to identify whether peak flows have generally increased or decreased. This indicator also analyzes whether large flood events have become more or less frequent over time, based on daily discharge records.
This indicator starts in 1965 because flood data have been available for a large number of sites to support a national-level analysis since then.
