

Environmental Protection Agency: Climate Change Indicators - Ragweed Pollen Season

This indicator depicts changes in the length of ragweed pollen season in the United States and Canada.
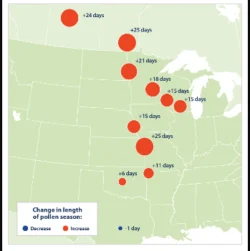
This indicator shows changes in the length of the ragweed pollen season in 11 cities in the central United States and Canada. These locations were selected as part of a study that looked at trends in pollen season at sites similar in elevation, but across a range of latitudes from south to north. At each location, air samples have been collected and examined since at least the 1990s as part of a national allergy monitoring network. Pollen spores are counted and identified using microscopes.
Pollen counts from each station have been analyzed to determine the start and end dates of each year’s ragweed pollen season. Because the length of ragweed season naturally varies from year to year, statistical techniques have been used to determine the average rate of change over time. This indicator shows the total change in season length from 1995 to 2015, which was determined by multiplying the average annual rate of change by the number of years in the period.