

Environmental Protection Agency: Climate Change Indicators - Marine Species Distribution

This indicator examines changes in the location of fish, shellfish, and other marine species along U.S. coasts.
This indicator tracks marine animal species in terms of their “center of biomass,” which is a point on the map that represents the center of each species’ distribution by weight. If a fish population were to shift generally northward, the center of biomass would shift northward as well. This approach is similar to the way changes in bird population distributions have been measured (see the Bird Wintering Ranges indicator).
Data for this indicator were collected by the National Oceanic and Atmospheric Administration’s National Marine Fisheries Service and other agencies. These agencies monitor marine species populations by conducting annual surveys in which they trawl the ocean at regular intervals along the coast. By recording what they catch at each location, scientists can calculate each species’ center of biomass in terms of latitude, longitude, and depth.
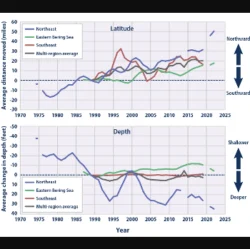
This indicator focuses on two survey regions that have the most continuous and longest-running sampling: the Northeast and the eastern Bering Sea off the coast of Alaska. Figure 1 shows the average change in the center of biomass across 105 species in these regions. For consistency, Figure 1 is limited to species that were identified every year. Figures 2 and 3 show detailed changes for three species in each region. These species were chosen because they represent a variety of habitats and species types (a mixture of fish and shellfish) and because they tend to be fairly abundant. Some of these species support major fisheries, yet are presumed to not be heavily impacted by overfishing, reducing the chance that fishing is unduly influencing the observed trends. Northeast data come from surveys that have been conducted every spring since 1968, while Bering Sea data come from summer surveys that have been conducted consistently since 1982.