

Environmental Protection Agency: Climate Change Indicators - Streamflow

This indicator describes trends in the amount of water carried by streams across the United States, as well as the timing of runoff associated with snowmelt.
The U.S. Geological Survey measures streamflow in rivers and streams across the United States using continuous monitoring devices called stream gauges. This indicator is based on data from 192 stream gauges located in areas where trends are not substantially influenced by dams, reservoir management, wastewater treatment facilities, or land-use change. The indicator also excludes stream gauges with watershed areas that overlap substantially.
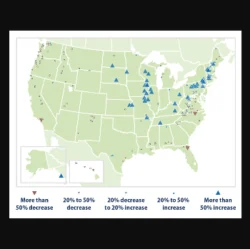
This indicator examines four important measures of streamflow conditions that occur during the course of a year. Figure 1 shows trends in the lowest flows each year, which are commonly calculated by averaging the lowest seven consecutive days of streamflow. Figure 2 shows trends in high flow conditions, which are commonly calculated by averaging the highest three consecutive days of streamflow in a year. Three days is an optimal length of time to characterize runoff associated with large storms and peak snowmelt. Figure 3 shows changes in the annual average streamflow, which is calculated by averaging daily flows through the entire year.
Figure 4 shows trends in the timing of winter and spring runoff. This measure is limited to 56 stream gauges in areas where at least 30 percent of annual precipitation falls as snow. Scientists look at the total volume of water that passes by a gauge between January 1 and July 31 for the western United States, and January 1 and May 31 for the eastern United States, then determine the date when exactly half of that water has gone by. This date is called the winter-spring center-of-volume date. A long-term trend toward an earlier date could be caused by earlier spring snowmelt, more precipitation falling as rain instead of snow, or other changes in precipitation patterns.