
This indicator measures the amount of land in North America that is covered by snow.
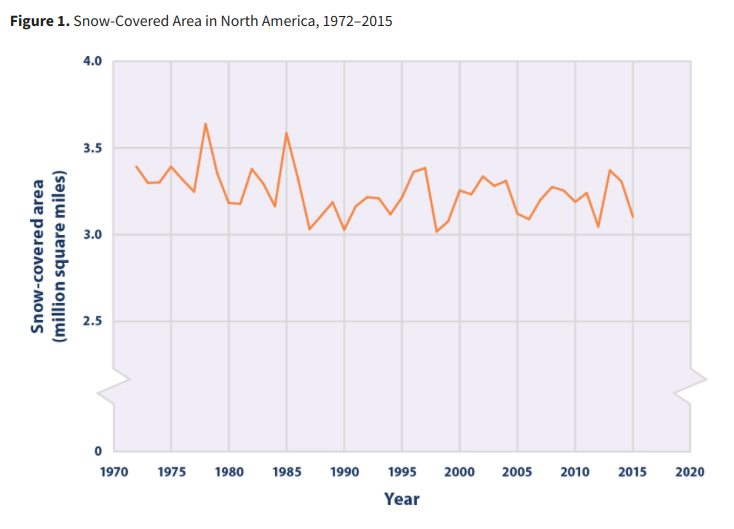
This indicator tracks the area covered by snow since 1972, based on maps generated by analyzing satellite images collected by the National Oceanic and Atmospheric Administration. Figure 1 was created by analyzing weekly maps to determine the total extent of snow cover, then averaging the weekly observations together to get a value for each year. Figure 2 uses the same method, but with average snow cover calculated for each season: spring (defined as March–May), summer (June–August), fall (September–November), and winter (December–February). These two figures cover all of North America, not including Greenland. Figure 3 focuses on the contiguous 48 states plus Alaska. It shows the average date when snow first starts to cover the ground in the fall, the average last date of snow cover in the spring, and the length of time between them. These snow cover season dates have been averaged over all parts of the country that regularly receive snow.
